Municipal dollars in Ontario—where did the money go?

Municipal budget season in Ontario recently ended and the evidence reveals some fairly substantial tax increases around the province. For example, Waterloo Region approved a property tax increase of 6.9 per cent while Toronto passed an increase of 9.5 per cent. Hamilton ultimately saw an increase of 5.8 per cent after fears of a double-digit tax increase were unveiled in the fall while Kingston saw one of the lower increases coming in at 3.5 per cent. For the most part, these increases exceed the current consumer price index (CPI) inflation rate of approximately 3 per cent and rather anemic GDP growth performances.
Given these tax increases have exceeded both inflation and income growth, it’s more than a matter of curiosity to understand what drives the increases. Municipal governments in Ontario provide numerous services to ratepayers, and their budgetary actions can have a major economic impact on households and individuals. An overview of municipal expenditures at the provincewide level using data from the provincial Municipal Financial Information Return illustrates not only how much total expenditures and household taxes have grown but the categories driving the expenditure over time.
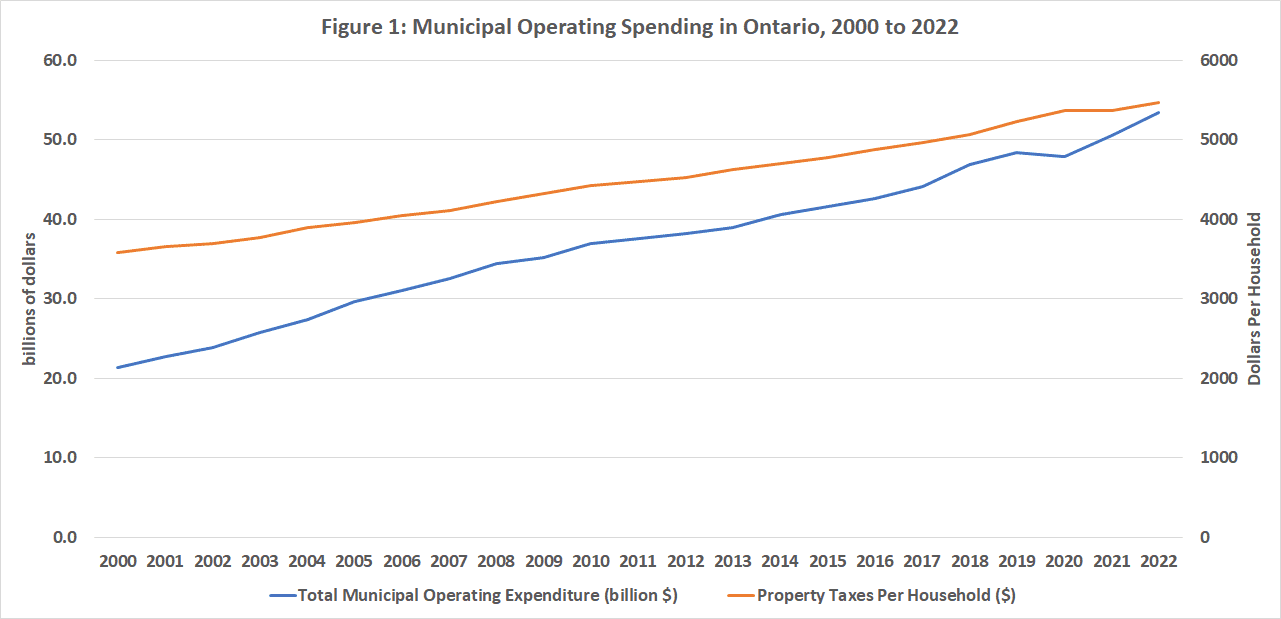
The first chart below plots total municipal expenditures along with average property taxes per household from 2000 to 2022. Since 2000, municipal operating expenditures have more than doubled going from $21.3 billion to $53.4 billion. It should be noted that total municipal operating spending has grown by 151 per cent while population has grown 61 per cent and the number of households by 134 per cent. Meanwhile, property taxes used to fund that spending have also grown from an average of $3,580 per household to $5,471 per household. Importantly, municipal operating expenditures do not include capital spending and much of that spending has been funded by debt. From 2000 to 2022, municipal net debt grew from $3.8 billion to $25.5 billion—nearly a six-fold increase in debt.
Over this period, the municipal workforce in Ontario grew from 216,367 to 234,235—an increase of 8.3 per cent over roughly 20 years. Much of the additional municipal spending is going into higher wages and salaries per employee rather than simply more employment. Indeed, any examination of the public-sector salary disclosure data for Ontario finds that the number reported earning more than $100,000 grew from 586 in 2000 to 61,021 in 2022 while the average salary for those over $100,000 rose from $118,333 to $127,294—an increase of eight per cent. While the average salary of those earning more than $100,000 has increased modestly, the growing number of municipal workers earning those high salaries has been the big expenditure driver. Put another way, in 2000 approximately one-third of one per cent of municipal employees on Ontario earned $100,000 or more whereas in 2022, that percentage had grown to 26 per cent.
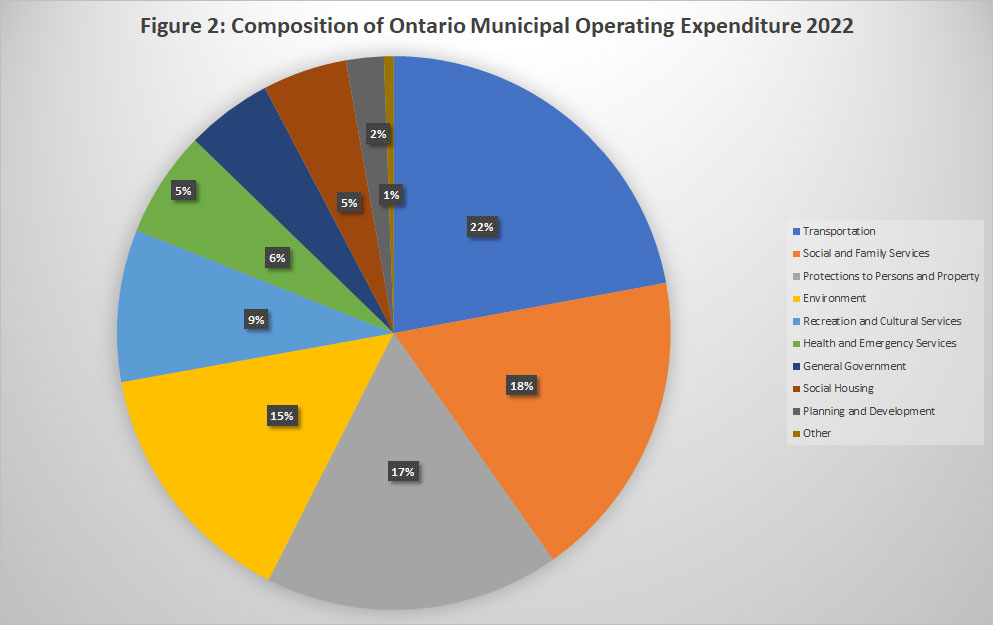
Where does the money go? The second chart shows the composition of municipal operating expenditures in 2022—the four largest expenditure items were transportation (22 per cent), social and family services (18 per cent), protection to persons and property (17 per cent) and environment (15 per cent). These four items together accounted for more than 70 per cent of municipal operating expenditures. What’s more interesting is the growth rates of all these categories since 2000 especially when compared to the growth rate of economic indicators.
Municipal operating expenditures since 2000 have grown the most in the categories of health and emergency services (335 per cent) followed by planning and development (215 per cent), then transportation and “Other” categories at 207 and 208 per cent respectively. Of the 11 expenditure categories, nine have grown faster than either nominal provincial GDP, real GDP, population or inflation (see third chart below). General government and social and family services have grown the least at 45 and 79 per cent respectively. While the relative restraint with respect to general government is welcome, the slower growth of social and family services given the social problems afflicting many Ontario cities seems a curious choice of priorities.
So, pulling everything together, here’s the story that emerges. Municipal operating expenditures in Ontario over the period 2000 to 2022 have grown 2.5 times faster than general inflation and double that of population. They have also grown a bit faster than the province’s output.
The increase in spending is driven by spending on wages and salaries but not in the manner one might think. Average salaries in the municipal sector for those making more than $100,000 annually since 2000 have grown by only 8 per cent but the number of individuals making those salaries has grown in the thousands of per cent. Within the broader public sector, in 2000 municipal employees accounted for 6 per cent of individuals on the salary disclosure list whereas by 2022 they accounted for 23 per cent.
In Ontario, municipal tax dollars have gone not so much into an expansion of services but into paying substantially more for roughly the same total number of people providing those services. And the areas of greatest spending increase have been in health and emergency services and planning and development. While the former can be explained by the pandemic and the opioid crisis, one must wonder where the value for money is with respect to planning and development given shortages of affordable housing and homelessness that have been allowed to develop across Ontario’s municipalities over the long term.


