Comparing Municipal Government Finances in Metro Vancouver

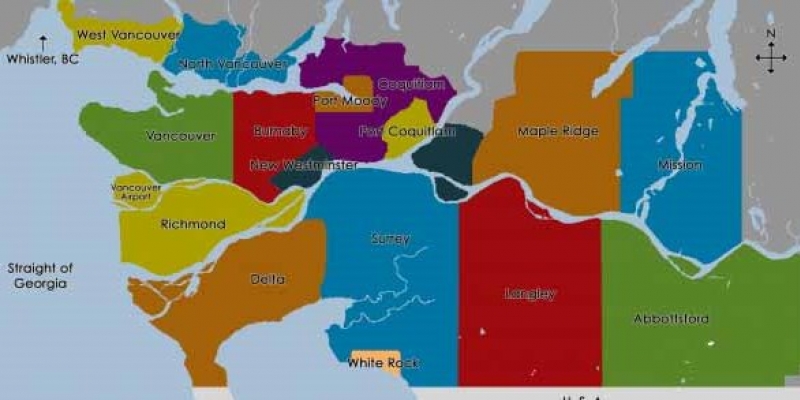
Municipal governments play an important role in the lives of British Columbians by providing important services and collecting taxes. But municipal finances do not receive the same degree of public scrutiny as more senior governments. This can pose a problem for taxpayers and voters who want to understand how their municipal government performs, especially compared to other municipalities. This report provides a summary analysis of important financial information for 17 of the 21 municipalities in Metro Vancouver, spanning a 10-year period (2002–2012).
Government spending
There is considerable variation in per-person spending among the 17 Metro Vancouver municipalities. West Vancouver, the highest spender in 2012 (at $2,118 per person), spends more than twice the amount of Surrey, the lowest spender (at $951 per person), and more than one-and-a-half times the regional average ($1,384 per person). But the large differences in per-person spending do not seem to be driven by population. For instance, the City of Vancouver has the largest population and is the third highest spender ($1,689 per person), while Surrey has the second largest population and is the lowest spender (17th). From 2002 to 2012, all 17 municipalities increased spending beyond the rate needed to accommodate inflation and population growth but the growth in inflation-adjusted spending per person was faster in some municipalities: Pitt Meadows had the fastest growth (81.9%) and New Westminster had the slowest (13.1%). The regional average was 27.1%.
Government revenue
There is also great variation in per-person revenue among the 17 Metro Vancouver municipalities. In 2012, West Vancouver collected the most revenue per person ($2,548)—nearly $1,100 more per person than Surrey ($1,451), which collected the least, and one-third above the regional average ($1,916). All municipalities except Port Moody saw substantial revenue growth over the decade. Pitt Meadows had the highest growth at 80.6%, with Coquitlam following closely behind at 74.4%. New Westminster recorded the slowest positive revenue growth (24.3%). For the region as a whole, inflation-adjusted revenue per person (35.9%) grew faster than spending (27.1%).
Government debt and interest spending
Virtually all Metro Vancouver municipalities examined in this report have net financial assets. Vancouver and West Vancouver are the only two that have net liabilities (gross liabilities greater than financial assets). Van-couver, the more notable exception, has net liabilities of $402 per person compared to Burnaby’s net assets of $2,914 per person.


