
A really quick history of Canada’s federal debt
With the federal government poised to table a budget in two weeks and embark on a new era of deficit financing and debt accumulation, it’s useful to take a quick long-term look at the finances of the federal government from a more historical perspective. Using data from the Canada Yearbook for the period 1867 to 1965 and the Federal Fiscal Reference Tables for 1966 to 2014 and the 2015 federal budget for 2015, Figure 1 (below) plots the total federal net debt in billions of dollars from 1867 to 2015.
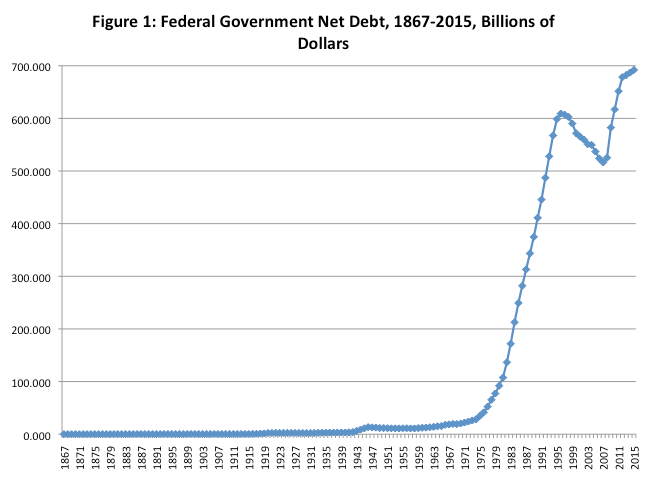
In 1867, the net debt of the Government of Canada was $75.7 million. During the nation-building phase of the Canadian economy from 1867 to 1913, which entailed the subsidized construction of transcontinental railways and the settlement of the West, the net debt grew from $75.7 million to $314.3 million. As a result of the First World War and the Great Depression, the net debt grew to reach $3.1 billion by 1938. The Second World War saw the net debt climb further to reach $11.3 billion by 1945. Growth of the public debt continued and the 25 years between 1945 and 1970 saw the debt reach $20.3 billion.
The period since 1970 witnessed enormous growth in the federal net debt as successive deficits combined with high interest rates saw the net debt rise from $20.3 billion to reach a peak of $609 billion in 1996—the era of the federal fiscal crisis. The period of federal restraint that followed combined by relatively robust economic growth saw balanced budgets and a reduction in the federal net debt to $516.3 billion by 2007. With the financial crisis and recession of 2008-09, federal net debt began to rise again and by 2015 had reached a new all-time high of $692 billion.
The current net public debt of Canada represents the accumulation of all the deficits plus interest over the 149 years since Confederation. Put another way, $672 billion—or 97 per cent of the current debt—has been acquired in the 46 years since 1970. Between 1867 and 2014, the average annual rate of growth of the federal net public debt comes in at 6.8 per cent. Compare that to population, with an annual average growth rate of 1.6 per cent, and inflation at 2.4 per cent as measured by the annual average growth rate of the GDP deflator. Real per capita federal net debt (in 2015 dollars) grew from $577 in 1870 and reached $19,302 in 2015.
As Figure 2 shows, our real per capita federal net debt peaked not during the eras of war or depression but in 1996 at $30,394. Even after recovering from the federal fiscal crisis of the 1990s, our real per capita debt remains higher than it was during the Second World War.
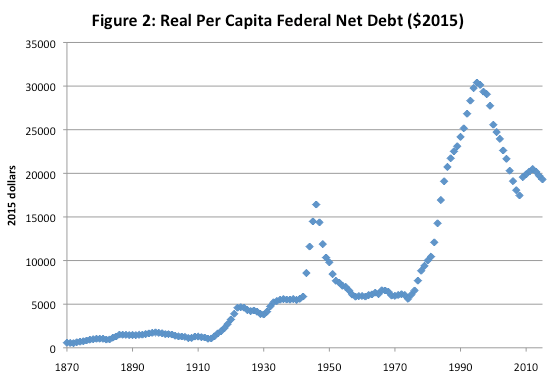
While as a share of GDP, the federal net public debt was highest during the era of the Second World War, on a real per capita basis we currently owe more than what we accumulated to help fight a global war with the Allies to save the world from totalitarianism.
Not sure what we have to show for our current level of per capita federal debt.
Author:
Subscribe to the Fraser Institute
Get the latest news from the Fraser Institute on the latest research studies, news and events.