BC is returning to its big spending ways of the 1990s

During the 1990s, British Columbia’s economy generally suffered from lacklustre growth and poor fiscal performance. To bring the extent of BC’s fiscal and economic weakness into focus, consider that the 1990s have been referred to as the province’s “lost decade”. In every year of the 1990s, BC ran budget deficits—at a time when many other provinces were implementing successful fiscal consolidations and producing balanced budgets. Following the fiscal consolidations of the early 1990s, nearly every other province saw its net financial position (government liabilities minus financial assets) relative to GDP either essentially hold steady or improve over the second half of the 1990s. BC, on the other hand, saw continued growth in its debt-to-GDP ratio through the second half of that decade.
Back in 2001, my colleagues Jason Clemens and Joel Emes noted that undisciplined government spending was one of the root problems of BC’s fiscal and economic woes during the 1990s (the other being uncompetitive tax rates). Specifically, in a detailed analysis of BC’s fiscal and economic situation, they wrote:
“The root of the economic problems in British Columbia is poor public policy founded on a belief in the efficacy of a more activist and interventionist government. Over the last decade, real per capita government expenditures in British Columbia have increased 7.5 percent, compared to declining expenditures of 0.6 percent in Ontario and 19.7 percent in Alberta. Government spending as a percent of GDP increased by 13.3 percent in British Columbia over the 1990s while it decreased 2.8 percent and 27.0 percent in Ontario and Alberta, respectively.”
With a new Liberal government elected in 2001, and a new focus on more prudent fiscal management, BC’s fiscal situation began to improve.
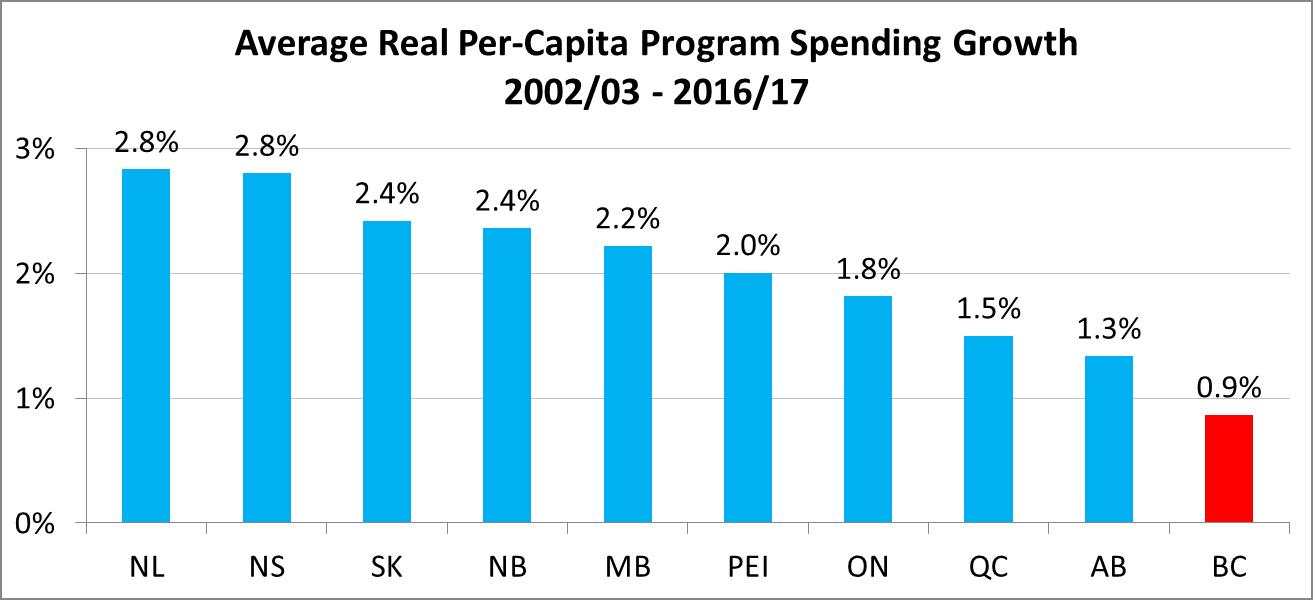
In a recent examination of program spending (all spending excluding debt service payments), my colleagues and I found that BC exercised greater spending restraint than any other province in the decade and a half after 2001. The chart below illustrates this by comparing the growth in real (inflation-adjusted) program spending per person in all 10 provinces between 2002/03 and 2016/17. It shows that real per capita program spending in BC increased at an average annual rate of 0.9 percent over the period—the lowest rate of any province. Newfoundland had the highest rate of spending growth at 2.8 percent while Ontario’s rate was 1.8 percent and Alberta’s was 1.3 percent. These differences in the annual spending growth rate between provinces may appear relatively small at first glance. However, compounded over time they have a substantial impact on a province’s overall spending level.

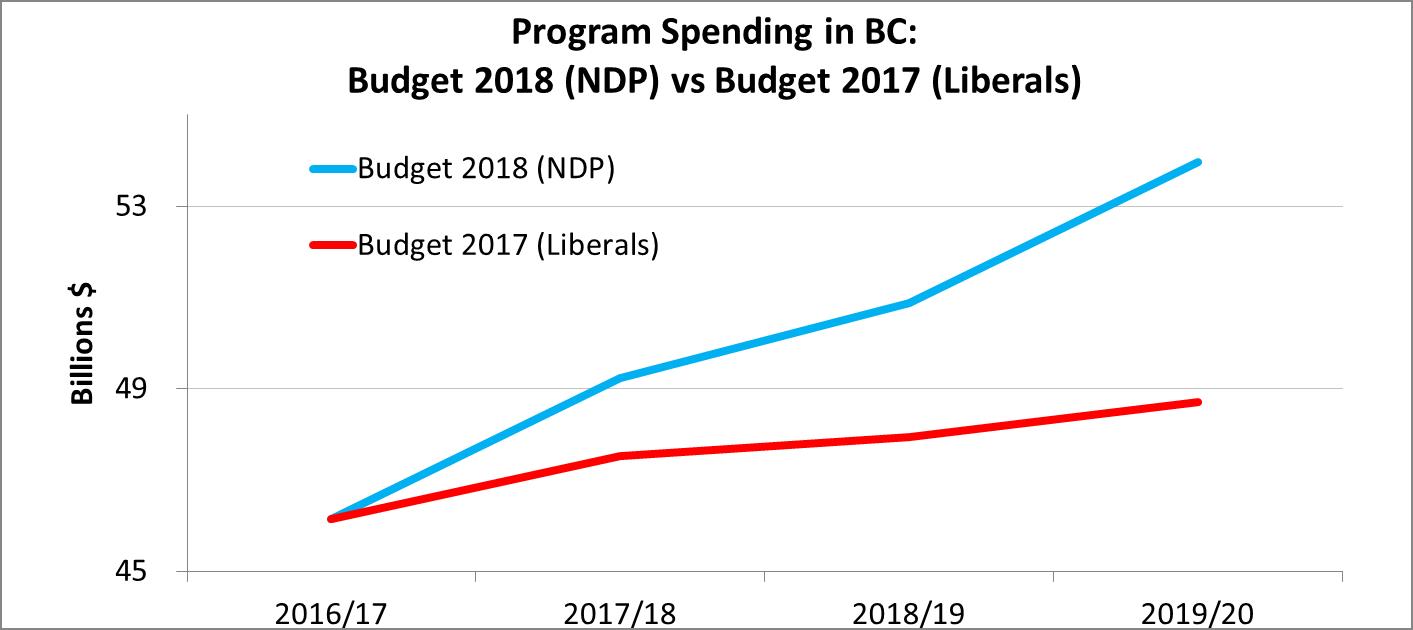
Things have changed again in BC with a new NDP government assuming power in July 2017. Based on BC’s latest budget, we’re seeing early signs of a reversion back to the big spending ways of the 1990s. As evidence, the following chart displays program spending in BC from 2016/17 to 2019/20 under both the previous Liberals plan from the 2017 budget and the current NDP plan from the 2018 budget. Cumulatively, the NDP plan is to spend $9.9 billion more over the course of three years than the Liberals. Moreover, from 2017/18 to 2019/20, the NDP plans to increase program spending at an average annual rate of 5.2 percent, which is double the 2.6 percent planned under the Liberals.

After just one full year in power, it seems British Columbians may be seeing history repeat itself with a return to the big spending NDP government of the 1990s.
Author:
Subscribe to the Fraser Institute
Get the latest news from the Fraser Institute on the latest research studies, news and events.

