
Doomsday predictions rely on flawed climate models

This is the first installment of a three-part essay series on climate science and policy in Canada and around the world.
Much of the debate around manmade climate change, and the timing and stringency of government policies meant to manage the risk of climate change, is based on the perception that the descent into catastrophic climate degradation seems to always be about 10 years away.
Over the last 30 years, the media has made this clear. “A senior U.N. environmental official says entire nations could be wiped off the face of the Earth if the global warming trend is not reversed by the year 2000,” wrote Peter James Spielmann of the Associated Press in 1989. “UN scientists warn time is running out to tackle global warming. Scientists say eight years left to avoid worst effects,” wrote David Adam in the Guardian in 2007. “We have 10 years left to save the world, says climate expert,” wrote HuffPost’s Laura Paddison in 2020.
It all sounds terribly worrying. But where does this idea originate—that the climate catastrophe (or an irretrievable tipping point into one) is 10 years away?
The answer may surprise you. It does not come from simple extrapolating what we’ve seen regarding the rates of temperature change and greenhouse gas emissions since 1950 (when humans started putting significant amounts of greenhouse gases into the atmosphere). Instead, the 10-years-to-catastrophe idea stems from a set of speculative forward-looking computer models generated across the research network of climate change modellers, as summarized by the United Nations Intergovernmental Panel on Climate Change (IPCC), considered by many to be the authoritative body on all things climate.
Three broad types of prospective models underpin the 10-year tipping point paradigm:
- Models of greenhouse gas (GHG) emissions based on future estimates of population, economic growth, technology development, etc.
- Models of atmospheric warming caused by those GHG emissions expected to manifest in the future
- Ecological impact models that estimate what impact a warmer climate will have on a variety of ecosystems in the future.
The outputs of these three types of modelling have varied since they first took the stage in the Second Assessment Report of the IPCC published in 1995, but it was not until the Third Assessment Report of the IPCC in 2001 that the triad of models would be assembled to create the new “tipping point” paradigm.
In the Third Assessment Report, three figures show the evolution of the separate model components. These figures show the 2001 estimated range of outputs for the three sets of models. One set of models (j) measures “radiative forcing,” (a surrogate term for the heat-retaining impact of the GHGs). The second graph (k) shows how much the global atmosphere would be expected to warm under a variety of futuristic scenarios. The spaghetti lines will be explained shortly. The chart on the right shows how impacts to the Earth’s various biologic, ecologic and social systems could increase as the climate warms.
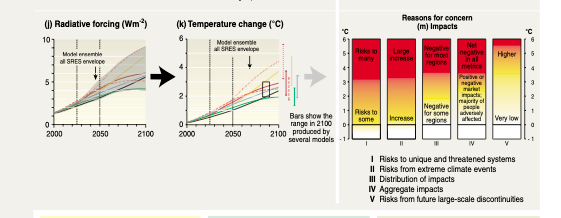
The chart on the right is basically the origin of the maximum allowable warming targets defining the goals for global policies to control GHG emissions after 2000. The fourth bar from the left shows the point at which impacts from climate warming become “Net negative in all metrics,” which in 2001, was not predicted to be reached until the increase in global average temperature reached about 3.5°Celsius. That temperature point according to chart (k) was not predicted to be locked in by projected increases in greenhouse gas concentrations, as you can also see, until around the year 2100, and even then, only under extreme scenarios of future greenhouse gas emission levels. However, in chart (k), the IPCC has given us a drop-line at the intersection of the magic number of 2°C (the point where mid-range models of accumulated greenhouse gases assess that we’ll reach the tipping point into climate catastrophe). That point was scheduled to arrive in 2050.
This is how the “we have X years to avert Y disaster” scenarios evolved in subsequent IPCC reports. In the IPCC Fourth Assessment Report (2007), the net-harm threshold drops to a range of from 1.5 to 2.5°C, locked in by greenhouse gas emission trends in 2020; In the IPCC Fifth Assessment Report (2014), the net-harm threshold drops to about 1.6°C, to become unavoidable in 2030; and in the IPCC Special Report Global Warming of 1.5C (2018), the net-harm threshold drops to 1.5°C, still estimated to be unavoidable by 2030. This carries through to the most recent draft report of the IPCC, the Sixth Assessment Report (2021).
But about those scenarios. As mentioned above, IPCC future scenarios are not based on actual real-world data for the last 20 years. They are speculative scenarios of the future, envisioned by special research groups within the IPCC research community. The full explication of this exercise in predicting the future can be found here. Critical caveats that often go undiscussed are important in understanding the scenarios and their utility. In the introduction to the IPCC Special Report on Emission Scenarios (2000) (SRES), for example, the IPCC explains that: “Future greenhouse gas (GHG) emissions are the product of very complex dynamic systems, determined by driving forces such as demographic development, socio-economic development, and technological change. Their future evolution is highly uncertain.”
The IPCC further explains that a “set of scenarios was developed to represent the range of driving forces and emissions in the scenario literature… No judgment is offered in this report as to the preference for any of the scenarios and they are not assigned probabilities of occurrence, neither must they be interpreted as policy recommendations”
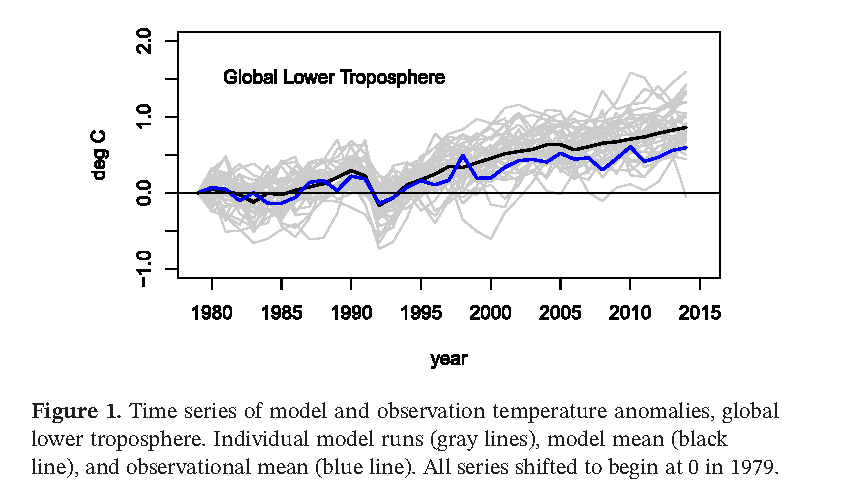
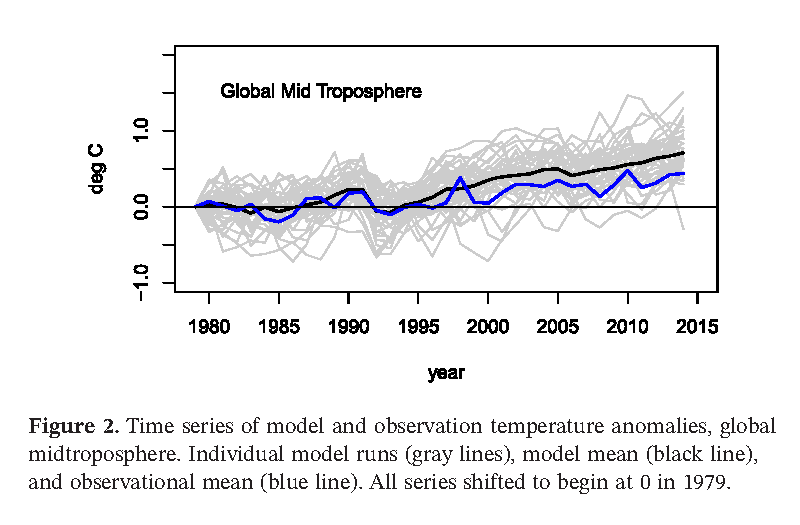
But there’s one glaring problem with these prognostications. They do not mesh with reality. In a research letter published in the journal Earth and Space Science, climate researchers Ross McKitrick and John Christy show that most of the models used to project climate warming as a result of increasing GHG concentrations exceed observations of the actual climate response of the last 35 years. The charts below represent different modelled estimates of warming that were expected to occur from 1980 to 2015, with the heavy black line representing the average of the estimated model warming. The blue line, however, shows the actual empirically measured temperature trend in the Earth’s troposphere. The discrepancy between predicted and observed temperatures post 2000 are plain to see.
The prevailing wisdom that underpins the sense of climate urgency in today’s policy debates—10 years to save the world!—stems from three sets of speculative models developed over the last 30 years by scientists working under the umbrella of the IPCC.
But empirical evidence taken from the real world suggests that the IPCC’s estimates of future warming are overstated, and what scientists have seen from looking at actual measurements of increased GHGs in the environment, and the recent rise in global average temperatures makes it clear that these “10 years to save the planet” invocations are based more on science fiction models and less on scientifically determined facts.
Overreliance on these flawed models results in policy recommendations and decisions that miss more effective and actionable solutions, particularly those related to adapting to a changing climate whether that change is natural or manmade. Examples of such actions might include strengthening coastal protections against rising tide levels, strengthening the capabilities and protection of water distribution systems to account for potential drought or flood-prone periods, improving flood control systems and snow-management capabilities in Canada’s cities, improving forest management techniques to adapt to potential changes in fire seasons or pest distributions, strengthening power systems needed to deliver sufficient affordable energy for heating and cooling of homes and businesses in the event of climate fluctuations, and more.
Author:
Subscribe to the Fraser Institute
Get the latest news from the Fraser Institute on the latest research studies, news and events.