
Employment levels during COVID—some provinces fared better than others

The pandemic and its lockdowns, quarantines and travel restrictions had major effects on Canadian employment especially in the international travel industry, the labour‐intensive personal services, food and accommodation, tourism, and arts and entertainment sectors. The initial impact during the first wave of the pandemic in the spring of 2020 was exceptionally severe and the recovery to pre-pandemic employment levels took considerable time.
Total seasonally-adjusted monthly employment in Canada in January 2020 was 19,115,500 and rose to 19,143,600 in February 2020. With the arrival of COVID-19, Canada saw a 5.3 per cent drop in employment in March 2020 and another 11 per cent decline the month after, bringing total employment down to 16,145,800—a total decrease of 16 per cent or nearly three million jobs. In two months, Canada’s total employment fell to a level last seen in the summer of 2005. Employment then began to rebound but did not exceed the pre-pandemic level set in February 2020 until November 2021.
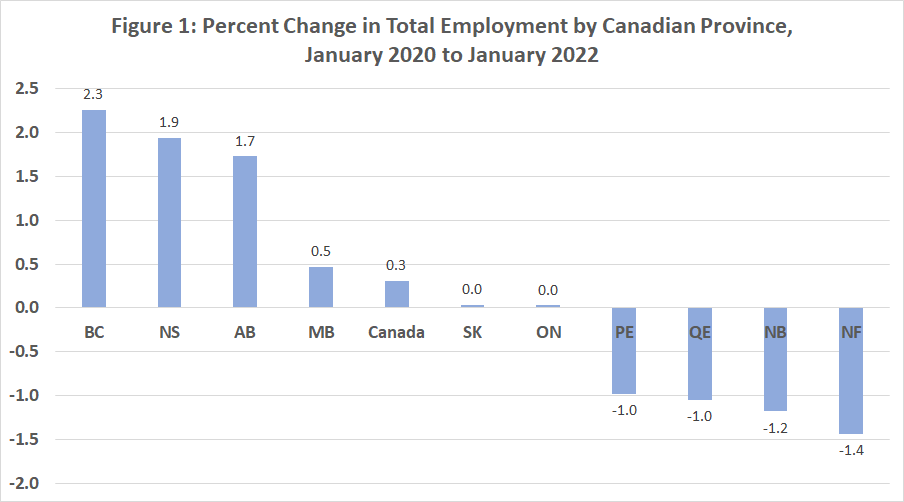
In terms of the long-term employment rebound, there are differences across Canada’s provinces as illustrated in the first chart below. Between January 2020 and January 2022, overall employment was up one-third of one per cent. Provincially, the strongest rebounds were in British Columbia, Nova Scotia and Alberta, which had their total employment 2.3, 1.9 and 1.7 per cent higher than going into the pandemic. Manitoba, Saskatchewan and Ontario were also up but not as dramatically as the three frontrunners. Meanwhile, Prince Edward Island, Quebec, New Brunswick, and Newfoundland and Labrador were still not back to where they were prior to the pandemic.
While several factors can explain regional employment and unemployment performance based on historical regional and labour market factors, there’s also the impact of the pandemic and especially of assorted lockdowns and other stringency measures. While the Atlantic provinces and Quebec have historically had poorer labour-market outcomes compared to the rest of Canada, they also had some of the strongest stringency measures during COVID with Ontario not far behind in terms of the length of lockdowns.
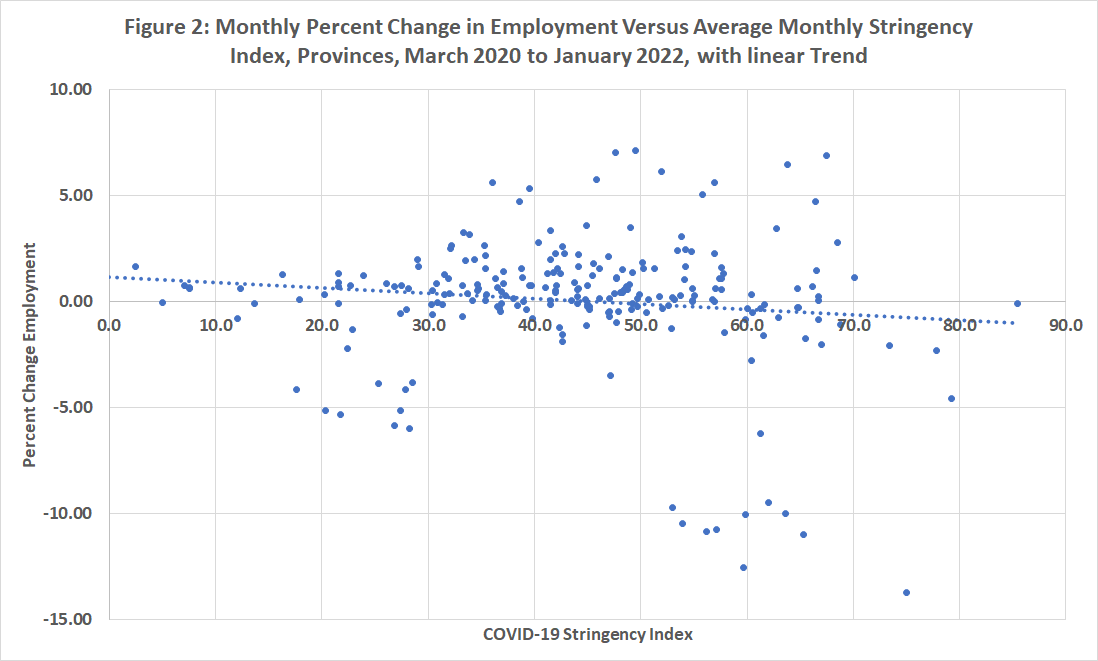
The second chart plots monthly employment growth for all provinces against a stringency index measure for each month and fits a linear trend. There’s a correlation between a higher stringency index value (more restrictive policies) and more negative monthly employment performance.
One of the advantages of federalism is that regional jurisdictions provide laboratories for different policies. When average monthly stringency over the entire pandemic is compared, Nova Scotia had the third-highest stringency after Quebec and Newfoundland and Labrador while B.C. had the third-lowest, ahead of Alberta and Saskatchewan. Yet both B.C. and Nova Scotia have had a comparable employment recovery. Indeed, there may be lessons to be learned from B.C. and Nova Scotia on how they managed their pandemic response in a manner that combatted COVID-19 while managing to lead the country in employment recovery by the pandemic’s end.
Author:
Subscribe to the Fraser Institute
Get the latest news from the Fraser Institute on the latest research studies, news and events.