
Government debt—a snapshot of each province

The 2018 edition of the Federal Fiscal Tables is out, so it’s a good time to review the state of provincial government debt in Canada, especially given that we are about 10 years out from the financial crisis and Great Recession. Even though Canada apparently weathered that period better than other G-7 countries (with respect to GDP growth and employment), the years since have seen large deficits at both federal and provincial levels and rising debt.
The first chart below plots net provincial government debt in 2007-08 and 2017-18 for the 10 provinces.

In absolute amounts, Ontario has been by far the greatest accumulator, with its net debt rising from $156.6 billion to $323.8 billion for an increase of $167.2 billion. As a share of GDP, Ontario has gone from 26 per cent to nearly 40 per cent.
The next highest achievers in the provincial debt competition were Quebec and Alberta who added $54.6 billion and $54.4 billion respectively. As a share of GDP, Quebec grew from 41 per cent to 44 per cent while Alberta went from -13.4 per cent to 6 per cent. Indeed, Alberta went from a net financial asset position of $35 billion to a net public debt of $19.3 billion.
All remaining provinces saw increases in net debt totals ranging from an increase of $18 billion for British Columbia to a low of $861 million for Prince Edward Island. B.C. saw its net debt-to-GDP ratio rise from 12 per cent to about 15 per cent while P.E.I.’s grew from 29 per cent to about 33 per cent. However, as a share of GDP, Newfoundland and Labrador now has the worse net debt position, with its net debt-to-GDP ratio rising from 35 per cent to approximately 46 per cent—the highest of the 10 provinces.
The percentage increases rather than the absolute dollar increases are also relevant given the varying output and population size of the provinces. The second chart plots the per cent increases in net provincial government debt from 2007-08 to 2017-18, from highest to lowest.
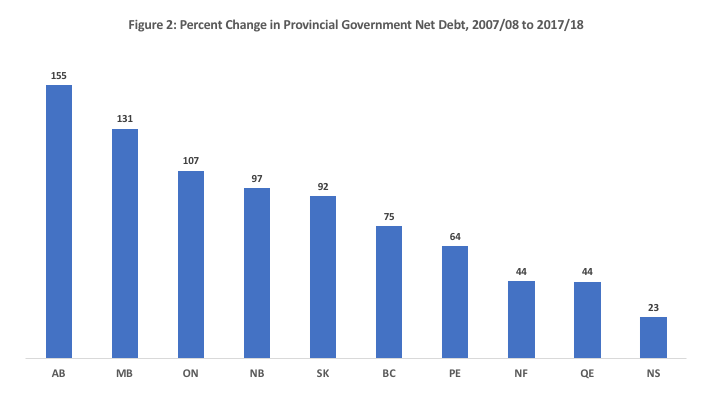
The largest percentage increases are for Alberta, Manitoba and Ontario, all of which saw their net debt more than double. Alberta saw its net debt position rise by an astounding 155 per cent (when the increase is based on the absolute value of the negative base number). Meanwhile, Manitoba saw its debt rise by 131 per cent, from $10.6 billion to $24.4 billion. And Ontario’s grew by 107 per cent.
Nova Scotia (23 per cent) had the smallest increase in provincial net debt over this period, followed by Quebec and Newfoundland (44 per cent each). However, Newfoundland’s performance is misleading given that its relatively good performance is a function of surpluses prior to 2011-12—it’s run very large deficits since. As for Nova Scotia, after a period of deficits, it ran surpluses for 2016-17 and 2017-18 but its progress is fragile given an aging population, which affects the finances of all the Atlantic provinces. As for Quebec’s finances, they are a good news story to date, as the budget was balanced in 2014-15 with substantial surpluses since then.
Taken collectively, the net debt position of the provinces is a serious problem. Over the 10-year period from 2007-08 to 2017-18, total net debt grew from $317.3 billion to $645.7 billion for an increase of 104 per cent. In addition, 50 per cent of the net debt belongs to Ontario—a proportion much larger than its population share of 39 per cent. If Ontario gets its finances under control, it will have a major impact on the total provincial debt situation.
Author:
Subscribe to the Fraser Institute
Get the latest news from the Fraser Institute on the latest research studies, news and events.