Government spending varies widely across major Ontario municipalities

With concerns about subnational fiscal sustainability a topic of recent reports, how governments spend their money should be always be of taxpayer interest. Municipalities are the tier of government closest to the public in terms of day-to-day service provision (police, fire, roads, etc.). And the rate of growth of municipal spending varies greatly across cities in Canada.
In Ontario, over the period 2010 to 2017, the average annual growth rate of municipal per capita spending in 29 major Ontario cities ranged from a high of five per cent for Mississauga to a low of 0.6 per cent for Windsor.
Which raises a key question. How efficiently are Ontario municipalities spending property tax dollars?
One facet of this question concerns administrative efficiency. That is, how much do Ontario cities spend on governance and what share of total spending does this entail? The annual BMA Municipal Study provides an estimate of municipal administration spending termed “general government spending,” which consists of three categories—governance, corporate management and program support. But the BMA report is quick to note that these costs can be influenced by a municipality’s organizational structure and whatever specific methods a municipality uses to allocate costs.
The first chart below plots general government municipal spending per $100,000 of tax assessment for 28 major Ontario cities ranking them from highest to lowest.

The range is quite striking, from a high of $257 for Thunder Bay to a low of $30 for Vaughn, with the average being $86. Smaller cities seem marked by higher administrative costs. Next after Thunder Bay is Sault Ste. Marie at $182 followed by Sudbury ($140), Oshawa ($130) and London ($128). Toronto clocks in at $53 in spending per 100,000 of tax assessment, Hamilton at $80 dollars and Ottawa at $55.Yet smaller cities are also among the lowest spenders on administration with St. Catharines, Niagara Falls, Cambridge and Oakville among the lower spending cities (all below $45).
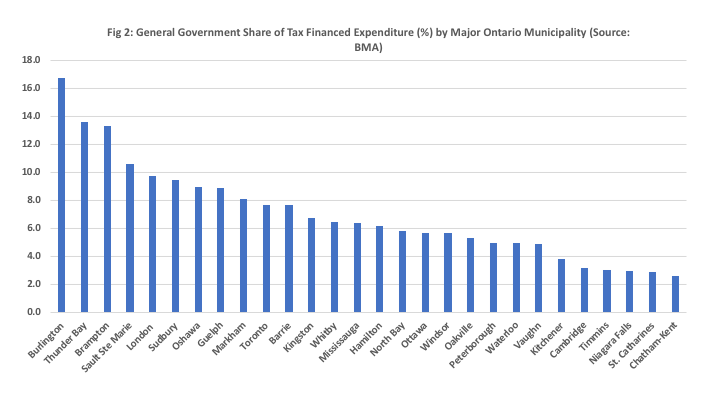
The second chart plots general government municipal spending as a share of municipal tax-financed expenditure, and again the range is striking.

Here, Burlington tops the list, spending nearly 17 per cent of tax-financed expenditure on general government, followed by Thunder Bay (14 per cent) and Brampton (13 per cent). At the other end, there are six municipalities who devote less than four per cent to general government—Kitchener, Cambridge, Timmins, Niagara Falls, St. Catharines and Chatham-Kent. The average share is seven per cent with Ontario’s largest city, Toronto, at eight per cent.
The question, of course, is why do some cities spend so much on general government? Do they have large city councils and associated bureaucracies?
Thunder Bay has one municipal politician for approximately every 8,500 people while Hamilton has one municipal politician for approximately every 33,500 people and Toronto (after its recent mandated reduction) has about one per 100,000 people. On the other hand, St. Catharines has about one municipal politician per 10,000 people, suggesting there’s more to this story. Perhaps it’s simply a matter of accounting and how cities choose to classify functions as governance. More seriously, it could be an indicator of bloated municipal administrative cultures.
Author:
Subscribe to the Fraser Institute
Get the latest news from the Fraser Institute on the latest research studies, news and events.

