Pandemics, social upheaval and government spending

The ramping up of Canadian federal and provincial government spending to deal with the COVID-19 pandemic will ultimately become a classic textbook demonstration of what’s known as the Peacock-Wiseman Displacement Hypothesis.
In their original work, now more than half a century ago, British economists Alan Peacock and Jack Wiseman observed that over the period 1890 to 1955, British government spending grew in a series of steps. Essentially, during the periods of the two world wars, British spending rose dramatically but afterwards never declined to pre-war levels but instead appeared to settle on a new plateau.
In explaining why this occurred, they developed an explanation that made use of the concepts of social crisis and upheaval and its effects on the supply side for government spending, namely, tax revenues. They argued that when it came to financing government spending, it was ultimately limited by tax revenues and tax revenues were constrained by what the public regarded as tolerable levels of taxation—even if more government spending was regarded as desirable.
After all, the opportunity cost of more government spending is foregone private spending as private incomes are reduced by current and future taxes.
A social crisis such as war essentially narrowed the divergence between desired levels of government spending and what the public regarded as a tolerable tax burden. However, once the social crisis was over, the taxes imposed remained and allowed government to permanently fund levels of spending at a higher level than what was in effect before the crisis.
Some of these expenditures could be obligations resulting from the crisis—for example, veteran’s pensions after a war. Others, would simply be new initiatives that could not previously be pursued because of revenue constraints. In other words, the trick was getting the saddle on the horse. Once buckled on, it would be harder for the horse to shake it off.
Of course, like all theories, it was not perfect.
A key problem was—what defined a “tolerable” tax limit? After all, the American colonies on the eve of the American Revolution felt they faced an intolerable tax burden from the British Crown, yet compared to British subjects residing in the United Kingdom, theirs was substantially lighter.
Moreover, why would taxpayers put up with an increased tax burden once the period of crisis was over? Surely, once the crisis was over, informed taxpayers would revert to balancing any benefits from the demands for government spending with the costs of higher tax levels. And of course, how does deficit-financing affect all of this?
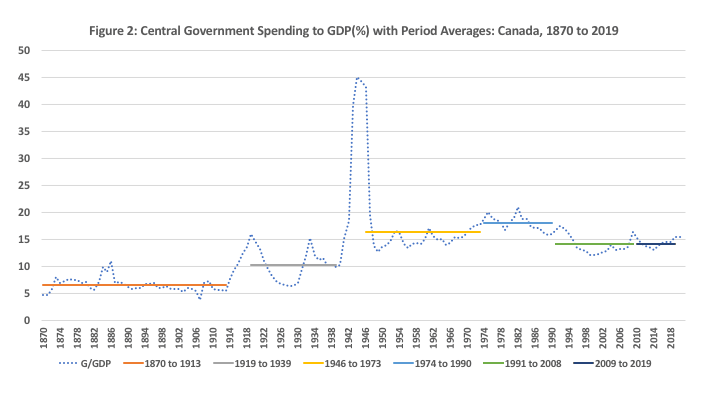
Nevertheless, the empirical evidence is interesting. Based on data from the Jorda-Schularick-Taylor Macrohistory Database, central government spending as a per cent of GDP for the period 1870 to 2016 is plotted for the United Kingdom (chart 1 below) and Canada (chart 2 below, with an extension to 2019).


When central government size is plotted as simply a time series, one gets an increasing government sector in both countries but with definite spending spikes during the periods of the two world wars as well as occasional smaller ones. If one takes period averages with the two world wars omitted, one can certainly observe a series of expenditure steps.
In the case of the United Kingdom, those steps have continued since the end of the Second World War with the era of the oil shock (1974 to 1990), the second globalization (1991 to 2008) and the post-Great Recession period (2009 to 2016) all marked by an ever-larger average central government spending-to-GDP ratio.
In the case of Canada, the period since the oil-shock era was marked by the federal fiscal crisis and the result was a step downwards in the size of the federal government fiscal footprint after 1991, which persisted even with the Great Recession. The difference between Canada and the U.K. is striking though the Canadian chart of course omits the provinces while the U.K. is generally more centralized than Canada when it comes to government spending.
Of course, the question is what happens now?
With estimates of the federal deficit ranging between $100 billion to $200 billion for fiscal year 2020-21, one can expect a sharp spike in Ottawa’s spending-to-GDP ratio, perhaps a doubling given the contraction in GDP also underway. Indeed, the pandemic crisis appears to have removed all the stops to spending, with spending for economic stabilization and income-support vastly exceeding any spending to bring the pandemic to heel, as the federal government increasingly takes on the mantle of an unlimited liability insurance company.
A doubling of the federal spending-to-GDP ratio would bring the size of federal spending relative to GDP to the highest level since the Second World War. Whether this is then followed by a new and higher plateau, accompanied by rising taxes, for the rest of the decade will be the next pressing question.
Author:
Subscribe to the Fraser Institute
Get the latest news from the Fraser Institute on the latest research studies, news and events.

